
Twitter moves fast, so you need to schedule your video posts when your audience is most active to maximize views and engagement; aim for weekday midmornings through early afternoons (especially Tue–Thu), test timing by timezone and niche, and rely on analytics to refine your schedule and align video content with real-time conversations for consistent reach.
Best Times to Post Videos on Twitter
Videos cut through the X feed differently than text: viewers are likelier to stop scrolling for motion and sound, so you should align video drops with high-attention windows. Short clips (15–30 seconds) perform best during quick-consumption moments like morning and evening commutes and lunch breaks; aim for 7–9 a.m., 12–2 p.m., and 6–9 p.m. on weekdays, while midweek (Tuesday–Thursday, 9 a.m.–3 p.m.) continues to show elevated engagement for breaking or timely video content.
Manufacture momentum by pairing a headline-first tweet with a muted autoplay thumbnail and a concise caption that prompts a view or reply; that combination increases initial impressions and can boost algorithmic distribution. Test a mix of formats—30-second highlights, 60–90 second explainers, and 6–15 second teasers—and track completion and retweet rates in your analytics to see which lengths and windows work for your audience.
Weekdays vs. Weekends
Weekdays are your best bet for short, newsy or service-oriented videos because users are active during work breaks and mid-afternoon scrolls; a bank or B2B brand posting a 45–60 second market recap at 7:30 a.m. or a customer-service demo at 11 a.m. will hit both commute listeners and deskbound viewers. For product launches or event recaps, schedule a teaser during the 9–11 a.m. window and a follow-up clip around 2–3 p.m. to capture secondary engagement peaks.
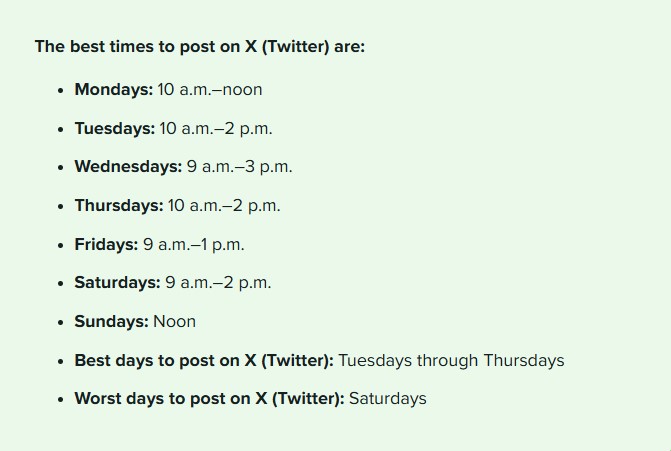
Weekend audiences scroll with more leisure time, so longer-form or emotionally driven videos do better—think 60–120 second behind-the-scenes, tutorials, or storytelling pieces published between 9 a.m. and 8 p.m. on Saturday and around noon on Sunday (our day-of-week analysis shows Saturday 9 a.m.–2 p.m. and Sunday noon as relative highs). Use weekend posts to deepen connection rather than chase immediate clicks.
Time Zones and Audience Reach
Global reach requires scheduling with audience geography, not platform convenience; post at local peak times for each market you serve. If your follower base is split across the US, UK and Australia, schedule repeats at 9 a.m. local in each region (for example, 9 a.m. ET, 9 a.m. GMT, 9 a.m. AEST) rather than a single global timestamp. Staggered posts avoid alienating large segments of your audience and increase the chance that different time-zone cohorts see the video during their highest-attention windows.
Use analytics to identify where 60–80% of your active followers live and prioritize those time zones first; for secondary markets, re-share the same video with a fresh caption or shortened cut 6–12 hours later to prevent feed fatigue while capturing additional reach. Tools with ViralPost-style optimization or X audience insights can automate this staggering and surface the exact hours your followers engage most.
Example tactic: a US-based brand wanting UK and Australian reach might publish its primary video at 12 p.m. ET to hit US midday and UK late afternoon (≈5 p.m. GMT), then schedule a tailored repost at 9 a.m. AEST the next morning for Australia—this sequence aligns with local routines and maximizes viewership without publishing the identical tweet at once across every zone.
Which Times to Avoid Posting on Twitter

Avoid posting when user activity is predictably low: late nights (roughly 11 p.m.–5 a.m. local time) and the small hours of the weekend. Your tweets posted then are more likely to be missed because fewer users are scrolling, and any engagement that does come in will take longer to accumulate, reducing initial momentum in the algorithm.
Also steer clear of times when your audience’s attention is focused elsewhere—commute peaks for B2B audiences or weekend leisure windows for consumer brands. Given the platform’s weekday concentration (Tues–Thurs, 9 a.m.–2 p.m.), you’ll often get better lift by avoiding off-peak windows where impressions are sparse and amplification is harder to trigger.
Peak Activity Hours
Peak windows (Tues–Thurs, 9 a.m.–2 p.m.) deliver the highest raw audience, but that same volume creates intense competition; your post can be buried within minutes unless it gains immediate interactions. If you’re running a campaign that relies on sustained visibility rather than a single-time burst, posting just outside these peaks—early shoulder slots like 7–9 a.m. or late afternoon between 3–5 p.m.—often yields a higher share of voice for niche content.
Try sequencing: publish a primary tweet during a shoulder hour, then follow up 30–60 minutes into peak time with a variant or reply to boost discovery among users who join later. Testing showed many accounts capture more long-tail engagement this way because the initial post avoids the midday churn while the follow-up taps peak audience density.
Holidays and Special Events
Major holidays and global events can either amplify or bury your content depending on relevance. Your routine promotional posts risk being drowned out during events that dominate timelines—examples include election nights, major sports finals, and large-scale holidays—when conversation volume spikes and attention fragments across trending threads.
When your content ties directly to an event, schedule around the event’s timeline: post just before key moments to capture build-up, or during quieter lulls between highlights to stand out. For customer-service or real-time response roles, ensure you have coverage during high-traffic moments; brands that staffed social during last year’s major events avoided delayed responses and preserved reputation.
Adjust for time zones and plan a three- to five-day buffer around major holidays: move evergreen posts into those windows, reserve promotional launches for non-holiday weekdays, and use analytics to compare engagement against baseline days. Run quick A/B tests across holiday-adjacent slots to find whether your audience prefers pre-event updates, live commentary, or post-event summaries.
Understanding Twitter’s Algorithm
Engagement Metrics
Twitter’s ranking favors content that provokes immediate interaction: retweets, replies and link clicks carry more influence than passive likes. Expect the first 15–60 minutes after you post to set the trajectory — tweets that earn a spike of engagement in that window are more likely to be amplified in followers’ feeds and in topic searches. Measure engagement rate as engagements divided by impressions; a 3–5% engagement rate on video posts indicates strong resonance for most brand accounts.
Video-specific signals matter beyond raw engagement counts. Watch time and completion rate tell the algorithm whether viewers found your clip valuable — a 30-second video that averages 20+ seconds watched will outperform a 2-minute clip with a 10% completion rate. Track CTA clicks, shares and follow-through actions (profile visits, link clicks) to link video performance to real outcomes; those downstream metrics influence how often the algorithm surfaces your future content.
Video Visibility Factors
Native uploads are prioritized: uploading MP4/H.264 video directly to X typically gets more impressions than tweeting a YouTube link. Aspect ratio and resolution also affect visibility — 1:1 and 16:9 perform well in timelines, while vertical formats (9:16) dominate in full-screen views; keep files under platform limits to avoid transcoding issues that can reduce quality. Captions and a compelling first frame boost autoplay engagement, since a large share of users watch with sound off.
Video length and pacing influence both completion and shareability. Short clips (15–45 seconds) often achieve higher completion rates and are more likely to be retweeted, while episodic or serialized longer videos can build repeat viewership if you consistently publish at predictable times. Combine timely hooks in the first 3 seconds with a clear CTA in the last 3–5 seconds to maximize watch-through and action.
- Upload video natively in MP4/H.264 and use an engaging poster frame to stop scrolls.
- Include accurate captions and a concise on-video headline to capture sound-off viewers.
- Keep most clips under 45 seconds for higher completion rates and easier resharing.
- Schedule posts to match your audience peaks (our data shows Tue–Thu, 9 a.m.–2 p.m. often outperform other windows).
- Knowing how these elements combine lets you prioritize quick edits that lift both impressions and watch time.
Optimize metadata and context to help the algorithm classify your video: add 1–2 relevant hashtags, tag collaborators or event accounts, and include a short, keyword-rich caption that frames the clip (avoid burying the hook in the image). Run A/B tests on thumbnail choices and upload formats; for example, testing a 30-second highlight versus a full 2-minute cut across identical posting times reveals whether your audience prefers quick summaries or deeper content.
- Monitor completion rate, average watch time and conversion actions in your analytics dashboard to identify what actually moves the needle.
- Run time-of-day experiments in week-long blocks to isolate posting windows that increase early engagement.
- Iterate on creative: try tighter edits, bolder captions, and different CTAs to see which combinations improve retention.
- Knowing which metric (impressions vs. completion vs. conversions) matters most for your campaign lets you optimize both creative and scheduling decisions.
Audience Considerations
Your audience makeup — time zones, job types and age groups — directly shifts the window when your videos get traction. If your followers are concentrated in business accounts or government handles, align more posts to weekday mornings (7–10 a.m. for financial services, per industry patterns); if they skew younger or consumer-facing, test evenings and weekend mid-days when casual browsing increases. Use the global benchmarks (Tues–Thurs, 9 a.m.–2 p.m.; Wed peak 9 a.m.–3 p.m.) as starting points, then narrow by the signals in your account analytics.
Segment your follower lists by region and interest, then run short experiments to validate timing. Try four distinct posting windows across two weeks and compare impressions, video views and engagement rate per impression to find a repeatable pattern for your audience instead of relying solely on global averages.
Demographic Insights
If analytics show a high proportion of 25–34 or professional audiences, prioritize midmorning to early-afternoon slots (9–2 p.m.) when working users check feeds between tasks. Younger demographics often generate more activity outside standard work hours; evenings (7–11 p.m.) and weekend mid-days can produce higher watch time and shares for lifestyle or entertainment video content.
Geography shifts those windows: UK and Australian audiences will reverse or shift your peak hours relative to North America, so schedule posts to local prime times rather than posting strictly by your home timezone. Use audience breakdowns in X Analytics or Sprout Social to map follower density by hour and adjust weekly calendars accordingly.
User Behavior Patterns
Short attention spans and fast-moving timelines mean most interactions cluster shortly after posting; posts that hit when your core followers are active get early likes, retweets and replies that amplify reach. News-driven spikes and live events (political debate nights, sports fixtures) create temporary engagement surges — align live or real-time video to those moments to capture higher conversation volume.
Weekday engagement patterns mirror work rhythms: commute, lunch and post-work windows show distinct activity bumps. Wednesdays show the broadest midmorning-to-midafternoon window (9 a.m.–3 p.m.), while weekends concentrate engagement into mornings and early afternoons (Saturday 9 a.m.–2 p.m., Sunday around noon), so adapt your video length and call-to-action to short attention spans during those windows.
For testing, track metrics by hour and aim for at least several hundred impressions per test slot to reduce noise; measure view-through rate, engagement rate and replies, then scale the slots that consistently outperform by 10–20% over baseline.
Tips for Maximizing Video Engagement
Front-load the value: hook viewers within the first 3 seconds with a bold visual, statistic or question so your retention rates don’t crater. Match video length to intent—aim for 15–60 seconds for quick social consumption, while explainer or demo clips can run up to the platform limit (2 minutes 20 seconds / 140 seconds) if the content justifies it. Native uploads outperform links, so upload natively, include captions, and test posting during the peak windows we covered (Tues–Thurs, 9 a.m.–2 p.m.).
- Keep native files under 512 MB; use H.264 video + AAC audio.
- Target 1920×1080 (landscape), 1080×1080 (square) or 1080×1920 (vertical) depending on placement.
- Use 30 fps and aim for a video bitrate around 3,000–5,000 kbps for 1080p.
- Include captions and a clear thumbnail; both increase watch-through on mute-heavy mobile feeds.
- Run A/B tests (2–3 variants) and track view-through rate, completion rate and CTR to refine creative.
Video Quality and Content Strategy
Prioritise crisp, mobile-first visuals: shoot at 1080p, stabilize footage, and crop to the aspect ratio that matches the feed—9:16 for Stories/short-form promotions, 1:1 or 16:9 for timeline posts. Use big, legible text overlays (minimum 24 px on mobile) for key messages so your point lands even with sound off; brands that adopt readable overlays and subtitles typically see higher completion on short clips.
Structure content as a three-part arc: hook (0–3s), value/demonstration (3–40s), and CTA/endcard (final 2–4s). For product demos, show a single use case in 20–45 seconds and include a timestamped clip or thread for deeper dives. Schedule higher-value, longer clips during weekday mid-mornings when users have longer sessions, and publish bite-sized teasers during afternoon peaks to drive click-throughs.
Call-to-Actions and Interactivity
Place CTAs both visually and in the copy: a short overlay CTA in the first 2–3 seconds and a final endcard with a one-line action (e.g., “Watch full demo” or “Reply with your take”) increase engagement signals. Use X-native features—polls, quote tweets, and pinned replies—to turn passive viewers into participants; for example, attach a 1-question poll to a 30–60s product clip to capture sentiment and boost replies.
Make CTAs specific and measurable: swap “learn more” for “tap to see 3 ways this saves 5–10 minutes/day” and track clicks with UTM tags. Thread follow-ups work well—post the main video, then add a 2–3 tweet thread with timestamps, behind-the-scenes clips or links to resources to extend watch time and improve discoverability.
Use prompted interactivity: ask a single, focused question in the tweet text, invite users to reply with a short clip or image, and reshare standout responses to create social proof and repeated impressions.
Any adjustments should be driven by your analytics: prioritize lift in view-through rate and completion, then optimize for CTR and replies as you iterate.
Analyzing Post Performance
Focus your analysis on the metrics that matter for video: impressions, engagement rate (engagements divided by impressions), link clicks, retweets, replies, and video-specific signals such as 3‑second and 30‑second view counts, average watch time and completion rate. Break those metrics down by posting hour, day of week and audience segment so you can compare like-for-like; for meaningful comparisons you’ll want at least 1,000 impressions per variant or a 7–14 day test window. Track rolling 7- and 30-day averages to filter out one-off spikes from real, repeatable patterns.
Establish baseline KPIs before you start optimizing: for example, log your current average impressions per post, CTR and 30s completion rate over a 30-day period, then set realistic improvement targets (a 10–20% lift is a practical short-term goal). Use cohort analysis to see whether time shifts, shortened videos or different thumbnails move those KPIs — if impressions rise but completion drops, the change may be getting more eyeballs but less retention, which signals a content or creative issue rather than a scheduling one.
Tools for Tracking Engagement
Use X’s native analytics for a quick pulse: impressions, engagements, video views (with view durations) and demographic breakdowns live in analytics.twitter.com. Complement that with Sprout Social or Hootsuite to aggregate cross-account data, schedule A/B tests and export standardized reports; Sprout’s ViralPost® can also recommend optimal send times based on your account’s historical performance. Add a social listening tool like Brandwatch or Talkwalker when you need sentiment, share-of-voice or campaign-level comparisons across competitors and events.
Instrument links with UTMs and monitor referral traffic and conversions in GA4 so you can tie video views back to on-site behavior — use utm_source=x, utm_medium=social, utm_campaign=video_launch for consistency. If you host long-form video off-platform, consider Wistia or Vimeo analytics to track heatmaps and exact drop-off points; combine those watch-time insights with X metrics to decide whether the issue is distribution timing or creative pacing.
Read more: Trending hashtag on Twitter
Making Data-Driven Adjustments
Design controlled experiments: test two to three distinct time slots (for example, 9–10 a.m., 12–1 p.m., 5–6 p.m.) across two weeks while keeping creative constant, then run the reverse experiment holding time steady and varying creative (thumbnail, first 3 seconds, caption length). Apply an A/B framework where each variant runs until it reaches your pre-set threshold (≥1,000 impressions or 7 days) so results are statistically actionable. You should log lift percentage for each KPI — impressions, CTR and 30s completion — and prioritize changes that move multiple KPIs in the right direction.
When a change produces a clear win, update your publishing calendar and repurpose the top-performing asset: clip a high-retention 15- to 30-second teaser, pin it during peak hours and amplify with a follow-up thread or promoted tweet targeted to the top-performing demographics. For global audiences, stagger reposts to match local peak windows rather than relying on a single “best time”; incremental reposts 6–8 hours apart often capture different time zones without overwhelming followers.
Use a short optimization checklist each week: compare current KPIs to baseline, run one new hypothesis (time, creative, CTA), verify sample size, and deploy winners into the schedule. Pay particular attention to retention at 3s/10s/30s — improving the first 3 seconds usually yields the largest jump in overall completion and downstream CTR.
Summing up
Hence you should target weekdays for video posts on X, with the strongest engagement typically Tuesday–Thursday between 9 a.m. and 2 p.m., Wednesday often extending to about 3 p.m.; Monday and Friday have narrower mid-morning windows (roughly 10 a.m.–noon and 9 a.m.–1 p.m.), while weekends generally see lower activity with Saturday mornings (9 a.m.–2 p.m.) and Sunday around noon offering modest peaks. Posting videos during midmorning to early afternoon leverages when users catch up on news and scroll during breaks, increasing the likelihood your clips receive views, replies and shares.
You should use your analytics to test these windows and run A/B experiments on post times and formats, adjust scheduling for your audience’s time zones and industry patterns, and repeat posts across peak periods to boost reach; also optimize video length, captions and thumbnails to improve retention and encourage engagement.